Project Management
Saturday, April 12, 2025
How to find the root cause of your project’s problems
I believe that one of the biggest difficulties for managers is finding the root cause of their problems in their projects. In this article, I will explain the techniques of hypotheses (and their formulations), the Ishikawa diagram, the 5 whys and the problem statement. These are the techniques I use day by day to resolve the issues in my projects.
You can’t deny, we make all possible plans to execute in a project, something not mapped previously will appear, that’s a fact, and the non-resolution of this problem will bring consequences like:
- Delay in the deliveries
- Delay launching the product or enhancements
- Problems with stakeholders
- Team feeling under pressure
- Lay-offs
I advise reading my article: “How to measure the productivity of your team and how to improve it” ) to manage your team and the article: “Stakeholders – improving your power and impact” para um melhor gerenciamento dos stakeholders envolvidos no projeto.
Returning to our article, when we face a problem, we can use techniques to have a deeper understanding and search for solutions, which will resolve our problem in its genesis. Let’s move to our first technique:
Formulation of hypotheses
Having a good formulation of hypotheses, we need to understand the problem given related to its characteristics, its context, its actors, which relations there are between them, which procedures there are inside the problem, and which results are expected VS obtained. Using the tool of a system diagram or even a network diagram, we have a good beginning to understand, focusing on process and results. I will give you an example and its explanation:
System Diagram - Network Diagram
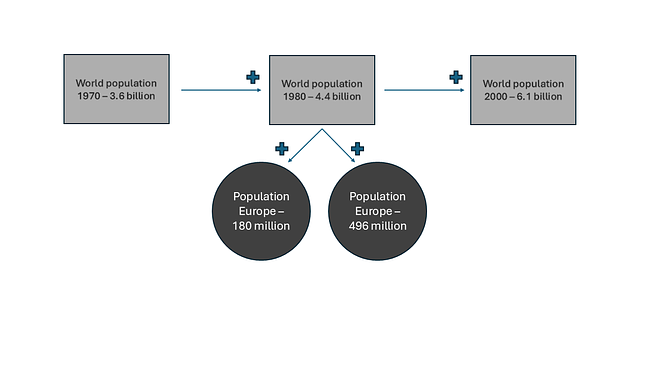
- Rectangles represent something accumulated throughout the time, like population
- Arrows represent flow: birth and death rates
- Circles represent auxiliary variables like population density
- Plus, and minus signs represent if the flow is increasing or decreasing
Stakeholder analysis
The stakeholder analysis is done to comprehend who the actors are, how they relate and, many times, which context they are inserted in. I will repeat here my article to make this analysis: “Stakeholders – improving your power and impact”
Scenario analysis
This point about the formulation of hypotheses is done to explore possible alternative scenarios about the problem’s evolution and how we can resolve them. We base ourselves on different assumptions, variables, and uncertainties. We validate the implications and risks from every scenario to the decision-making act. Here is the step-by-step and example:
- Identify the problem
- Define what’s influencing the problem
- Establish how this can evolve in the future
- Build different scenarios
- Compare the scenarios, considering advantages and disadvantages. Opportunities and risks, and their implications.
Example:
- Problem: My tech leader requested a salary increase
- Influence: work overload, excess of responsibilitys
- Evolution: ask to quit, delay on deliveries
- Scenarios:
- Tech leader asked to quit, and there isn’t any documentation for the project
- Tech leader starts passing his responsibilities to someone else, without formal documentation
- Other members of the team are dissatisfied because of the unexpected demands
- Tech leader asks to quit, and the manager doesn’t have senior developers
Disclaimer: Be careful to formulate hypotheses using unclear processes and stakeholders with big impact but not mapped correctly. The lack of clarity can cause us to make huge mistakes when creating our hypotheses.
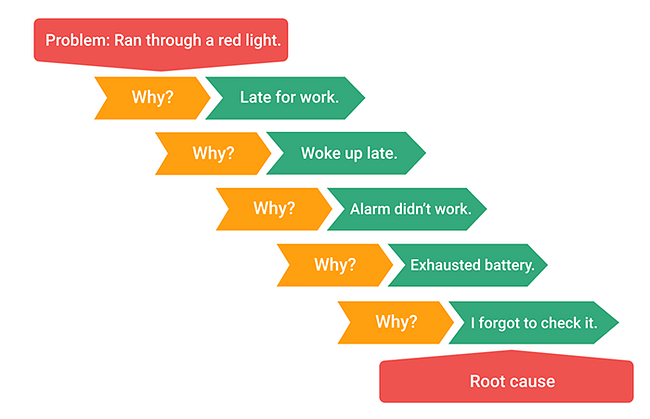
5 whys
In my opinion, the 5 whys technique is one of the best and easiest to discover a problem’s root cause. However, it works well if used transparently, even if we are dealing with political issues in a company. There can be that fear of speaking what is explicit to everybody. So, this technique won’t help too much. Ex:
- Why don’t we have access to the production machines?
- Because the security area hasn’t provided us with access to
- Why hasn’t the security area provided us with access to?
- Because they told us that to access the production, only the security team must enter it
- Why must only the security team access the production?
Everybody thinking:
- Because the CTO had required to

Even though the answer is obvious, the exercise of asking yourself until you get the root cause is revealing.Ainda assim, mesmo que a resposta for óbvia, o exercício de se perguntar até chegar à causa raiz é por si só revelador.
What are the advantages of the 5 whys?
I identify here advantages like:
- Identify process failures
- Analyze low performance
- Investigating conflicts
- Comprehend tendencies
- Understand the success of a product
- Understand a failure of a product
How to do the 5 whys exercise?
Despite the name, it’s not necessary to stop at the 5th question or to arrive at it. Number five was chosen because it is a good measure to find the root cause. The concept here is to ask yourself until you find the reason. In the above’s example, I could have continued: “Why had the CTO required to leave only the security team to access the production?” Another point to be used is to always start the next question using the previous answer. So, we can have traceability of our problem. Ex:
- Why are the tasks in delay?
- Because the developers are estimating them wrong
- Why are the developers estimating them wrong?
In the end, when we get the root cause, we can go to the solution. I will leave here another article that I wrote: “How to find the right solutions to your project’s problems.”
Ishikawa diagram
The Ishikawa diagram, often called Ishikawa fishbone diagram, is a technique used to gain an understanding of a problem from a systemic perspective, meaning, a general perspective. It is like taking a step back and seeing the overall scenario.
To make this, we are going to use a model like the image below, which I will explain step by step.
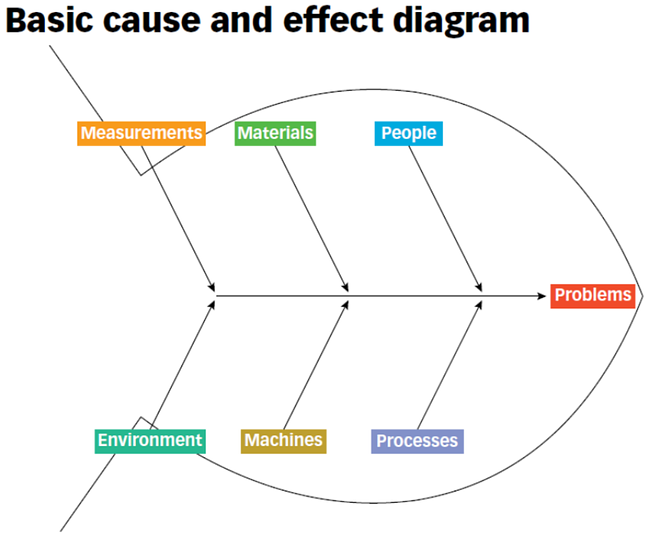
Fish’s head – initial problem
Here, we put our initial problem that needs to find its root cause. Ex: All our tasks are delayed
Fishbone and 6Ms
In our fishbone, we put the questions related to our main problem, verifying if it is in one of our Ms, that are:
- Machine: all the equipment, tools, and machines used
- Method: process and instructions adopted
- Material: raw materials, components, information
- Mission/mother nature: company’s environment, physical environment, company’s purpose
- Measurement: inspection, monitoring systems, controls
- Manpower: people involved
Let’s move to our example to create the diagram and, to do so, we will start with our main problem: “All our tasks are delayed.” From this problem, we will put on the fishbone the questions related to this main problem. Ex:
- Machine: Lack of DevOps to automatize the upload in staging and production
- Method: The refinements aren’t considering the developer’s experience
- Material: our components aren't reusable
- Mother Nature: -
- Measurement: -
- Manpower: many junior developers in the team, lack of a DevOps
Our diagram:
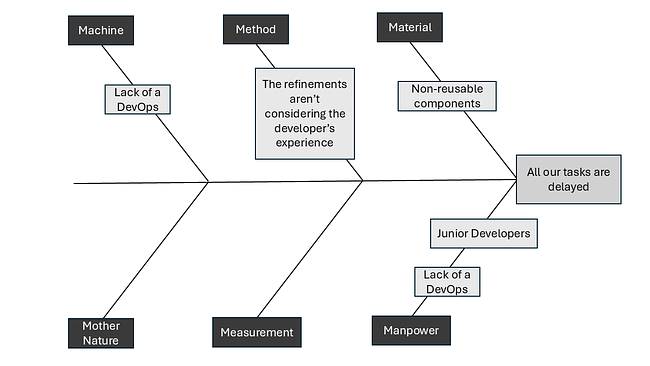
Notice two different points in our example:
- Not all Ms were fulfilled. Just those related to the main problem
- One question can be in two or more Ms, like the case of the team’s experience, which is on method and manpower, and the DevOps, which is on machine and manpower.
Disclaimer: In my understanding, when the same question appears in two or more places, it is a suitable candidate to be the root cause. I always prioritize it in my list of resolutions.
Disclaimer 2: The Ishikawa diagram can be used along with the 5 whys technique. Doing that, we are able to get the root cause for each M and, it can appear as sub-questions to resolve and finish the problem for good.
Problem Statement
Finally, after all the techniques to uncover the root cause, we’ve got to define the problem statement. But what is that?
The problem statement is a clear declaration of the problem we are going to resolve. It’s like a declaration of war to the problem. In this declaration, we specify the scope, how important it is, and what are our objectives to resolve it. We cannot leave behind the acceptance criteria and restrictions. I will explain here how to build this document and the example:
Build a problem statement
To this construction, we must:
- Define the problem with clarity – describe what happens, where, when, and why.
- Identify the stakeholders – who’s impacted by the problem, expectations, behaviors, and their position on this
- Criteria to evaluate the problem’s solution – here we can use the acceptance criteria and the objectives we intend resolving this problem. Examples are reduction of costs, time, improvement of quality, security, etc.
- Quantify the problem - if possible, quantify how much this problem is disturbing. Ex: 1 month of delay, costs of US$ 100,000 per semester.
- Explain the root cause – we can put here the results that we found by the above’s techniques.
Disclaimer: Remember that the problem statement must be SMART, I mean:
- Specific (S)
- Measurable (M)
- Achievable (A)
- Relevant (R)
- Time-bound (T)
Let’s go to our example:
“The delay rate on the user stories’ deliveries of the team X is about 20%, which brings a delay of 1 month each semester, generating additional costs of US$ 100,000 per semester and dissatisfaction to the final customer, CTO, CEO, and financial area. The main causes of these delays are the lack of experience of the team and wrong estimation. How can we decrease these delays to 5% in 3 months?”
Well, from now on, we can reach the resolution. Here, I share an article about it: “How to find the right solutions to your project’s problems.”
I arrive here at the end of this article. Here, you have learned 4 techniques to find the root cause of a problem.
What do you think about this article? Would you like to add any tool that you think is important?
Give a like on this article, comment on LinkedIn, or share it on your social media
See you soon!
Erik Scaranello