Project Management
Sunday, February 09, 2025
How to measure the productivity of your team and how to improve it
One question that all leaders around the globe ask themselves is: how to measure my teams’ productivity and how to make them productive (more). In this article, I will share some concepts and tricks that I use to organize better my teams and improve their productivity, reaching great results in a period relatively low.
But before, I will diminish a little the scope of this article (that would be my first advice) and work with user stories on a kanban board because my focus is on teams of software development and, inside these environments, kanban boards are widely used. So, let’s get started:
Be productive yes, but compared to what?
My first topic comes with Lewis Carroll’s conversation at Alice in Wonderland:
- Would you tell me, please, which way I ought to go from here?
- That depends a good deal on where you want to get to
- I don’t much care where
- Then it doesn’t matter which way you go
Having an idea of how to start measuring our productivity, we have to compare with something, qualitative or quantitative. Here, there are some places that I base myself on, like goals achieved. Ex:
- Has the sprint been achieved?
- PI goals? Are we getting there?
- KPI? Which ones we achieved and which ones we didn't.
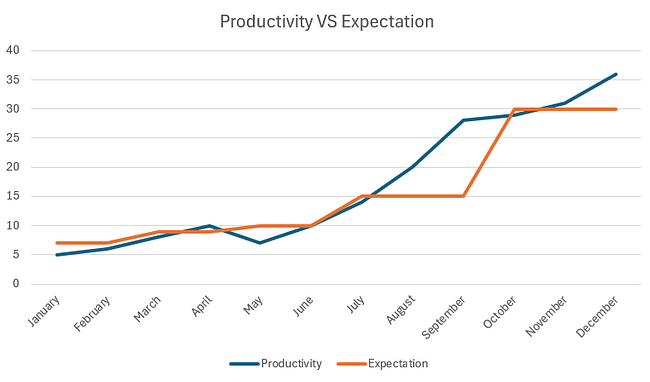
Beginning with these comparisons, we have an idea of team production VS what is expected, and from those, we will know if we are or how much we are behind the expectations.
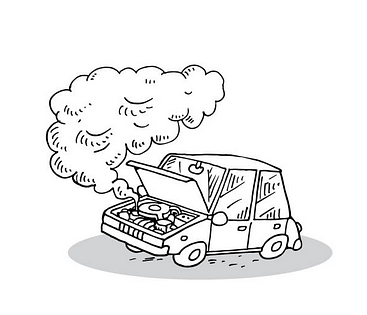
Disclaimer: be careful in putting too much pressure on the increment of your teams’ metrics if they are already good enough. Better to have a trip until the end at 60 m/h rather than go at 120 m/h and break the engine in the middle of the way.
Made the disclaimer, I will put here some methods that I get used to using to measure the team:
Measuring the kanban board
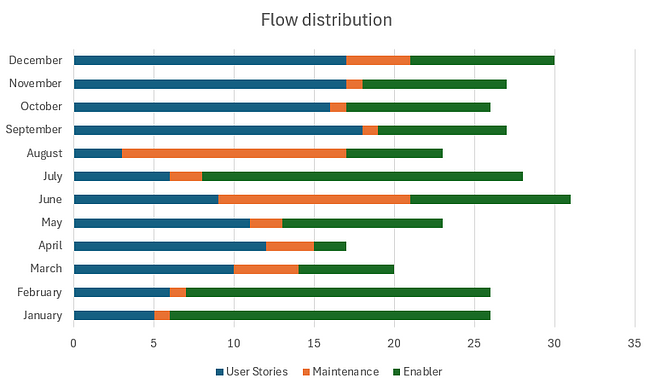
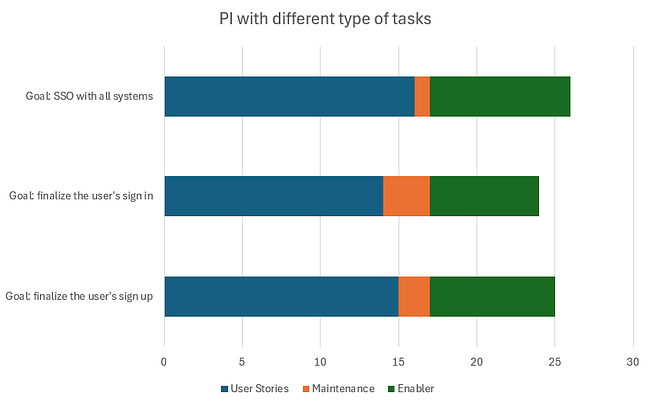
Splitting the tasks by the type (User Stories, Maintenance, Enablers)
It’s nothing more than comparing these 3 types to have a balance: the first to advance on the milestones, the second to not launch something that will make the user experience poor, and the third to have an architecture that can be escalated, increasing the market-share and gaining more customers. Below, I will share an example of how to verify the types of tasks that we have:
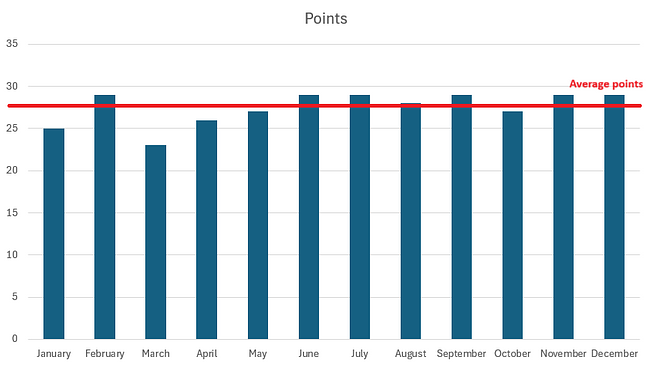
Flow Velocity
The trick here is to make comparisons between closed periods (sprint, PI, month, quarter) to understand how much your team can deliver using working hours, Fibonacci, days or any validation you are familiar with your team. With that information in hands, it’s easier to estimate the next tasks (still, it’s always difficult). I will share an example of the story points to a Scum/SAFe team.
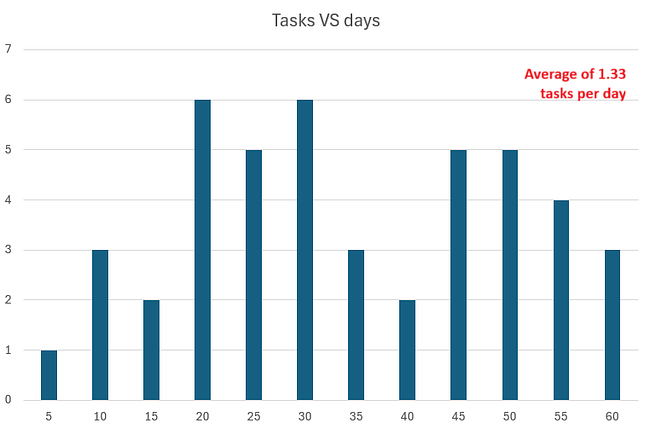
Flow time – from the beginning to the end
This measure serves to know in general how much a task or feature takes from the beginning of its production until its delivery. The degree of importance is increased when we cross the information with the type of task. Ex: maintenance tasks take in general 5 days to be fully executed, compared to user stories that take 3 days. Below, there is an example of how many user stories are executed VS number of days.
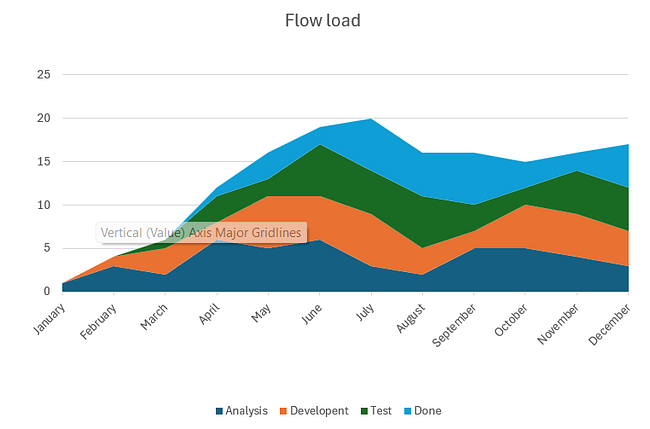
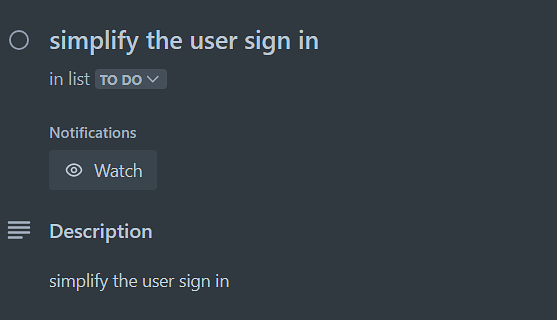
Flow load (active elements)
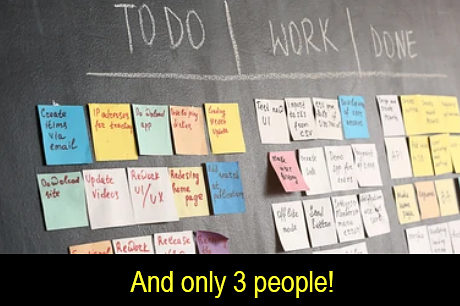
Indicates how many active elements you have on your board. I consider this one of the most important measures for a leader, but why? Basically, if you have 5 people in your team and 10 active elements, it means that 5 of these items should be elsewhere, right? Beyond that, seeing the board we know how many items are in each phase of our process. Ex: X tasks are being analyzed, Y tasks are in development, and Z tasks are done. Below is an example of how we can see those tasks.
Flow efficiency
In short, here we will understand how much time a task remains stopped from the end of a process (development, for example) until the beginning of another one (test). I will share the calculations to understand this metric. In case the math results are in 1, it means that you are not wasting time.
Flow time = active time – waiting time
Flow efficiency = Active time / flow time
How to improve the productivity of your team
Throughout the years managing projects, I have got some patterns that can be addressed to increase the velocity in deliveries and go faster regarding the time-to-market of a project. Here we go to them:
Maintenance VS User Stories VS Enablers
My comprehension (controversial) is:
- Users Stories are going forward
- Enablers are walking sideways
- Maintenance is going backwards
I will explain myself better:
Maintenance tasks are tasks that didn’t follow a defined process or there was some lack of information to produce them. Here, I will mention the article that I wrote: “Why having a great definition of ready/done is so important to bring clarity.” Correction tasks are just lack of information, scenarios, persona, or what should be done. To resolve this problem, the processes and communication must be improved, giving clarity, even tough will take more time.
Enabler tasks are super-important because they are the structure of what we are going to call product in the future. However, they are structures and, in general, are the creation and maintenance of environments that can be outsourced to give an increased velocity in project development.
At least, user stories… and yes! Those are the ones that will help us to move forward with the project and deliver it. The faster they finish, the better.
How much is the team delivering throughout a specific period.
Here, I will enter on the question: estimation VS reality. Particularly, I like the poker planner so much, not just because it helps to estimate a task, but because it gives us greater clarity of what needs to be done. From this point, it becomes simpler to get the story points (hours, days) that were delivered in the previous sprints (PI, month, etc.) and use them as a base to know what our team is capable of delivery.
Delivery time of a specific type of task
Let’s divide the tasks by their types: user stories, maintenance, and enablers. We can use the average time of each type of task to determine a print (PI, month, etc.) and estimate how much we are going to evolve with the project. In each period, we can focus more on a type of task, advancing in a specific field.
Waiting time to pass the activities between people
Simply put, verify each moment that the tasks are remaining stopped and correct. But this decision generally comes with a more executive one:
Do I spend time or money?
In general, tasks remain stopped because there are no sufficient people to develop them. In this case, we are wasting time related to money. If we add people to the team, the opposite happens because in many moments our professionals will be waiting for the end of another process. Ex: QA waiting for the development finishes its part of the task.
Disclaimer: People are single tasks. If you put them to do another activity, they will return to your sprint after they finish, generating waiting time.
How many active elements are there on the board?
Where there is no clarity on what needs to be done, many tasks begin to appear on the active side of the board, but why?
The professionals get the task, don’t understand what is supposed to be done, ask around, and while they don’t receive an answer, they start another one. I will enter here again in the article that I wrote: “Why having a great definition of ready/done is so important to bring clarity.” At the end, the simplicity works well: get the task and haven’t understood, ask the team. In case anybody knows how to explain, the task shouldn’t be in the sprint.
I arrive at the end of this article, and I hope you enjoyed it. Here, you have learned how to make the common measures to know the productivity of your team(s) and how to improve them.
Do you want to continue this conversation? Give a like to the article, comment on LinkedIn, or share it on your social media.
See you soon!
Erik Scaranello